This important statistical analysis demonstrates the magnitude of the meat industry around the world, which involves no less than 1.3 billion supporting workers. This is the industry that technocrat eco-loons want to destroy, and what can’t be destroyed will be substituted with synthetic food. Seriously? Yes, but it shows the anti-human fallacy of the entire movement. ⁃ TN Editor
Combined together, meat, dairy, and eggs make up nearly 18% of the average person’s diet.
But, as Visual Capitalist’s Pallavi Rao details below, in order for these meat and animal products to reach consumers, a vast global livestock industry – one supporting the livelihoods of 1.3 billion people globally – operates in fields and farms largely unseen from major cities.
So where are the various types of livestock concentrated in the world? And how do national consumption habits influence animal husbandry?
These maps from Adam Symington help to answer these questions, using the Gridded Livestock of the World database from the UN Food and Agriculture Organization (FAO), which models livestock densities from 2010 around the world.
Chicken, Beef, and Pork Livestock Density
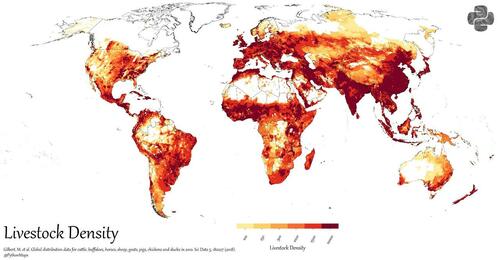
As a starting point, it’s worth noting that the above map of all livestock might seem reminiscent to a human population density map.
Though there is definite correlation, especially when it comes to natural obstacles for both humans and livestock like deserts, forests, and mountain ranges, the concentration of livestock spreads far further than the densest human cities.
We dive into each category of livestock below.
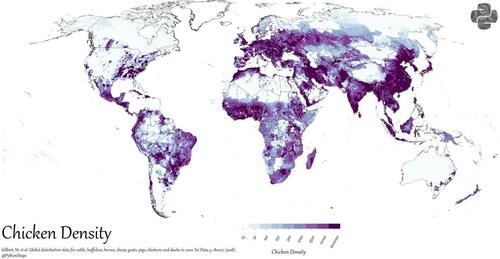
The UN FAO estimates that the world produced more than 121 million tonnes of chicken meat in 2021, making it the world’s most harvested meat. Chicken eggs are also estimated to account for 93% of the world’s 86 million tonnes of poultry eggs.
These numbers and the map below help illustrate the sheer number of chickens needed to support the world’s appetite for chicken goods.
Just by glancing at the heatmap map of chicken distribution, two things stand out clearly. First is how ubiquitous chickens are, with a high density of chicken livestock in almost all of the world’s populated regions.
But the map also gives us insight into where most farms are located. In the U.S. for example, Southern states including Georgia, North Carolina, Alabama, Mississippi, and Arkansas are major chicken producers. Likewise in countries like Brazil and China, the chicken industry can be seen continuing inland far beyond the more populated coastal regions.
Pig Livestock Density
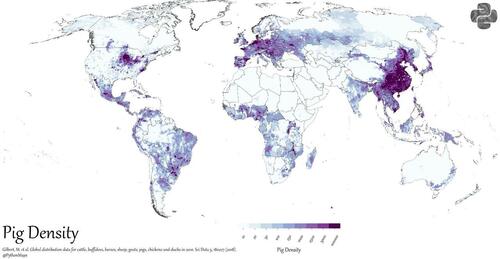
Shifting attention to pig livestock, we see densities begin to concentrate in a few specific regions.
China stands out on the map with large concentrations of pig livestock, which comes as no surprise given the country is far and away the world’s top producer of pork.
Also clear is the regionality of pork consumption. The U.S. has a strong concentration of pig livestock in the Midwest, while Central Europe has multiple countries with a noted history of pork consumption including Germany and Poland. Finally, partially thanks to its premium production of jamón ibérico, the country of Spain also stands out.
On the flip side, there is a clear absence of pig-rearing in countries of Islamic faith, across North Africa, the Middle East, and Central Asia, reflecting their religious prohibition.
Cattle Livestock Density
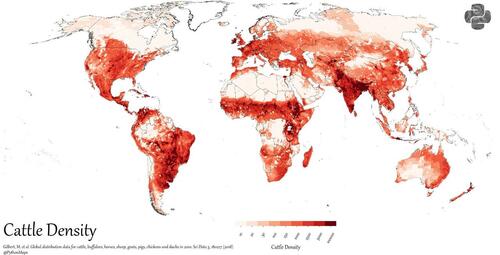
In contrast, the map of cattle distribution more closely mirrors chicken distribution, though its footprint is considerably wider.
Major cow byproducts like milk and leather, as well as the sheer strength of cattle, make them vital livestock even for countries that don’t consume a lot of beef. The FAO estimates that the world produced 746 million tonnes of raw cattle milk in 2021 alone.
On the map, the largest producers of cattle stand out. India for example is the top producer of milk and the fourth-largest producer of cattle meat, and has a high density of cattle throughout populated and agricultural regions. Brazil, also a top four producer of cattle meat and milk, has pockets of high density cattle regions inland, notably encroaching into the Amazon rainforest.
Meanwhile, the U.S. is the world’s largest producer of beef and second largest of milk, but it does this with a more distributed cattle population throughout the country’s landmass, and fewer high-density hot spots.
Patrick Wood is a leading and critical expert on Sustainable Development, Green Economy, Agenda 21, 2030 Agenda and historic Technocracy. He is the author of Technocracy Rising: The Trojan Horse of Global Transformation (2015) and co-author of Trilaterals Over Washington, Volumes I and II (1978-1980) with the late Antony C. Sutton.
[…] Global Warming Activism Targets Giant Global Livestock Industry And 1.3 Billion People […]
Goalive
July 28, 2023 8:25 am
Ein vernachlässigtes Thema ist nicht nur in diesem Kontext die Water Action Agenda, die der UN im März 2023 auf den Weg gebracht hat https://sdgs.un.org/conferences/water2023/action-agenda SDG 6 ist Wasser, SDG 7 Energie. Mit letzteren machen die Northstream-Deutschen gerade erste Erfahrungen, aber im Kontext Stadtplanung wird derzeit das sog. Wasserressourcenmanagement gehypt. Die beiden Ziele machen Sinn, denn das Trinkwasser und fossile Energieträger werden für die Rechenzentren benötigt, also muss man sie Mensch und Tier mit dem Mantra der Gleichheit (SDG10)wegnehmen. Das allein ist die Bedeutung von SDG 6 und 7. Wer es nicht glaubt, möge sich mit der deutschen HLPF vom… Read more »
Paul Reesor
July 30, 2023 7:12 am
Based on carbon footprint or energy used pastured animals would be by far the winner and the cheapest food but they want to destroy meat. Not only that people would get off all off pharma products and that’s the problem, pharma is in this big with vaccines to bring about population reduction.


[…] Source link […]
[…] Global Warming Activism Targets Giant Global Livestock Industry And 1.3 Billion People […]
Ein vernachlässigtes Thema ist nicht nur in diesem Kontext die Water Action Agenda, die der UN im März 2023 auf den Weg gebracht hat https://sdgs.un.org/conferences/water2023/action-agenda SDG 6 ist Wasser, SDG 7 Energie. Mit letzteren machen die Northstream-Deutschen gerade erste Erfahrungen, aber im Kontext Stadtplanung wird derzeit das sog. Wasserressourcenmanagement gehypt. Die beiden Ziele machen Sinn, denn das Trinkwasser und fossile Energieträger werden für die Rechenzentren benötigt, also muss man sie Mensch und Tier mit dem Mantra der Gleichheit (SDG10)wegnehmen. Das allein ist die Bedeutung von SDG 6 und 7. Wer es nicht glaubt, möge sich mit der deutschen HLPF vom… Read more »
Based on carbon footprint or energy used pastured animals would be by far the winner and the cheapest food but they want to destroy meat. Not only that people would get off all off pharma products and that’s the problem, pharma is in this big with vaccines to bring about population reduction.